%20--%3e%3cdefs%3e%3cstyle%3e%20.st0%20{%20fill:%20%23fff;%20}%20%3c/style%3e%3c/defs%3e%3cpath%20class='st0'%20d='M37.06,124.64c1.42-.39,3.06.14,4.14.77,29.56,17.44,67.54,6.48,83.47-23.79,9.31-17.68,10.16-36.97,1.54-55.34-1.29-2.76.63-5.66,3.07-6.48,2.76-.91,5.34.33,6.56,2.99,7.71,16.78,8.53,35.39,2.51,52.8-14.32,41.46-61.44,61.08-100.66,39.6l-28.54,8.18c-1.53.44-3.51-.85-4.32-1.78-1.07-1.23-1.51-2.99-1.06-4.68l7.42-27.48C1.75,93.06-1.86,75.29,2.43,56.85,9.85,24.85,36.89,1.27,70.09.31c14.91-.43,29.09,3.99,41.7,12.54l-.36-5.47c-.17-2.66,1.42-4.88,3.81-5.4,2.05-.44,5.56.58,5.97,3.25,1.09,7.06,1.8,14.07,2.44,21.4.2,2.3-2.47,4.71-4.65,4.73l-18.11.08c-2.8,0-5.09-1.59-5.5-4.35-.35-2.36,1.31-5.56,4.1-5.59l6.44-.08C76.96,1.23,36.92,10.4,19.4,41.02c-11.87,20.72-11.49,44.19,1.31,64.59.85,1.31,1.36,2.49.93,4.03l-5.58,20.83,20.99-5.85.02.02Z'/%3e%3cpath%20class='st0'%20d='M91.43,92.7c4.29,0,7.09-3.34,6.98-7.09-.11-4.05-3.59-7.03-7.8-6.51h-20.19l3.67-10.15,16.89-.03c3.39,0,5.97-2.47,6.48-5.72.33-2.08-.3-4.22-1.58-5.63-1.45-1.59-3.44-2.1-5.64-2.1l-14.72.05,3.1-10.18c4.29-.19,8.41-.33,12.75-.13,7.66.35,14.32,5.25,16.03,12.72,1.36,5.97-.65,11.99-5.85,15.54,3.21,2.02,5.5,4.76,6.49,8.59,2.55,9.85-4.33,20.06-14.94,20.56l-32.37.2,3.73-10.07,9.74-.08h17.21v.02Z'/%3e%3cpath%20class='st0'%20d='M68.08,68.96l-3.36,10.12-18.41.03-.06,23.7h-10.38v-56.96c0-.5,1.61-.71,2.14-.71h6.97l27.17-.02-3.18,10.34-22.63.14-.03,13.33,21.78.05v-.02Z'/%3e%3c/svg%3e)
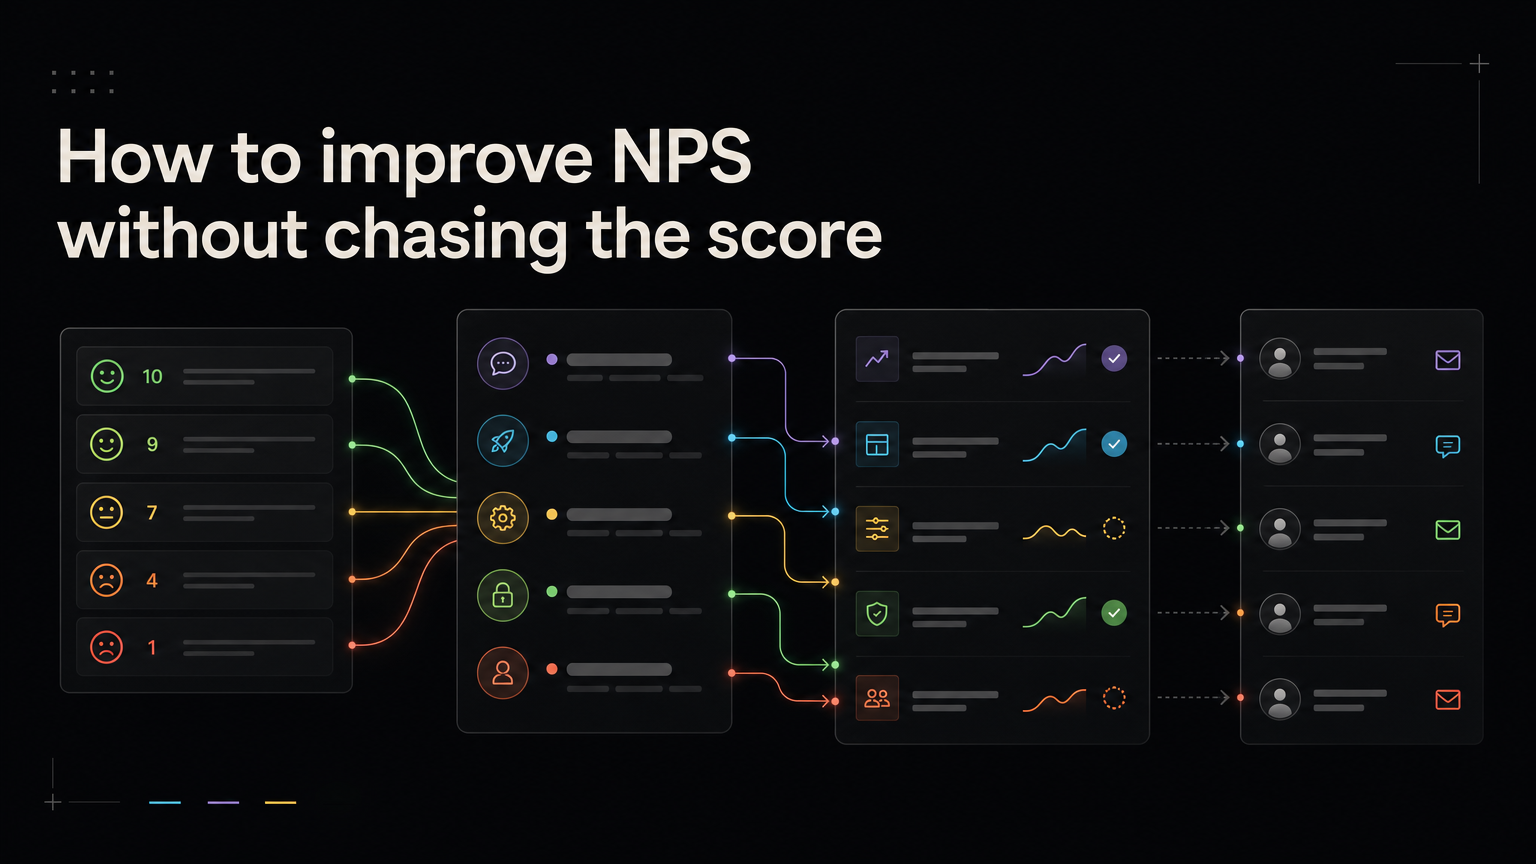
Net Promoter Score asks how likely a customer is to recommend your product. The number is easy to chart. The comments are where the work begins.
Trying to “increase NPS” directly often produces more survey reminders and fewer useful insights. Improve the customer experiences behind the score instead.
Ask at a meaningful time
Do not survey a customer before they have had a chance to receive value.
Choose a consistent point: after the first month, after a completed workflow, or before renewal. Keep the timing stable so changes in the score do not simply reflect a different audience.
Always include an open question:
What is the main reason for your score?
Follow up by response type
Detractors
Ask what happened and whether someone can help. Treat an urgent support problem immediately. Record repeated product issues in the feedback system.
Passives
Ask what would make the product more useful. Passive customers often reveal missing value without the frustration found in detractor responses.
Promoters
Learn which outcome they value and what almost prevented success. Ask for a review or referral only after addressing their comment.
Group comments into themes
Tag responses by problem, workflow, customer segment, and severity. Merge them with related support tickets and feature requests.
Look beyond the average score:
- Which themes drive low scores?
- Which customer segments are struggling?
- Did a recent release change the comments?
- Are promoters consistently using one workflow?
Assign an owner and decision
Every important theme needs an owner, not an automatic roadmap commitment.
The result may be a bug fix, onboarding change, documentation update, service recovery, product discovery project, or a deliberate decision not to act.
Tell customers what changed
When feedback leads to an improvement, notify the people who raised it. Link to a clear release note.
Closing the loop can improve the relationship even before the next NPS survey. Customers learn that giving a detailed answer is worth their time.
The useful question is not “How do we gain five NPS points?” It is “Which customer problem should we fix, and how will we know it improved?”
Feedboard keeps survey themes, product requests, roadmap updates, and releases connected. Organize customer feedback with Feedboard.
Understand the calculation
Respondents select a score from zero to ten:
- Promoters: 9–10
- Passives: 7–8
- Detractors: 0–6
NPS equals the percentage of promoters minus the percentage of detractors. The result ranges from -100 to 100.
The score is a summary, not a diagnosis. Always report response count, response rate, audience, channel, and survey timing beside it.
Design a reliable program
Choose a relationship survey for overall experience or a transactional survey for a specific event. Do not compare them as if they measure the same thing.
Control:
- Customer eligibility
- Minimum time since signup
- Survey trigger
- Suppression period
- Language and channel
- Whether multiple users per account respond
For B2B products, decide whether analysis happens by person or account. Ten responses from one large company should not silently outweigh ten separate customers.
Create a follow-up workflow
Scores 0–3
Look for urgent failure, security, billing, or broken workflows. Route immediate help before research.
Scores 4–6
Ask about repeated friction, unmet expectations, and the event behind the score. Link product problems to existing themes.
Scores 7–8
Explore what keeps the experience from being clearly valuable. Passives can expose ordinary gaps that do not create support tickets.
Scores 9–10
Identify the outcomes promoters value and what nearly prevented success. Ask for a review, case study, or referral only after responding to their comment.
Analyze themes, not isolated adjectives
Tag comments by workflow, problem, segment, lifecycle, and severity.
Compare:
- Detractor themes among new and established customers
- Scores by plan and role
- Customers who use the core workflow and those who do not
- Respondents and nonrespondents
- Themes before and after a release
- Accounts that later renew or churn
Do not assume NPS causes retention. Investigate whether the score and retention share underlying product experiences.
Worked example
NPS falls from 32 to 18 after a reporting redesign.
The team finds:
- Most detractor comments come from agency administrators.
- Usage shows report completion is stable.
- Support conversations reveal saved filters were removed.
- Agencies rebuild the same filters for every client.
The response is not a campaign asking for better scores. The team restores reusable filters, tests them with affected customers, publishes the change, and contacts the original respondents.
The next survey uses the same audience and timing so the result can be compared.
Create an action register
Theme:
Affected segment:
Response count:
Representative evidence:
Current workaround:
Owner:
Immediate recovery action:
Product or service decision:
Next review:
Customer update:
Separate service recovery from product development. One customer may need help today even when a broader feature is still under review.
Avoid common mistakes
Do not:
- Survey only active or successful users
- Pressure support agents to “improve the score”
- Send surveys too frequently
- Compare different samples without qualification
- Treat every detractor request as roadmap work
- Ignore passives
- Ask promoters for advocacy before reading their comment
- Close the analysis without customer follow-up
Metrics beyond the score
Track:
- Response rate and sample composition
- Time to follow up with detractors
- Themes with assigned owners
- Service recoveries completed
- Product issues moved to a decision
- Respondents notified after changes
- Retention and adoption by response group
These measures show whether the program changes the customer experience.
Frequently asked questions
What is a good NPS?
Benchmarks vary by market, audience, and survey method. Compare your score over time using a consistent method and focus on the experiences behind it.
How many responses are enough?
The answer depends on the decision and population. Always show the count and uncertainty. Small samples are useful for qualitative themes but weak for precise comparisons.
Should NPS be anonymous?
Anonymous surveys may encourage candor but prevent recovery and segmentation. Offer privacy clearly and collect identity only when the follow-up value justifies it.
How quickly should teams respond?
Urgent problems should enter support immediately. For other comments, set a realistic service level such as two business days.
A quarterly NPS review
Compare the current sample with the previous period, including audience, response rate, and survey trigger. Review the largest themes, changes by customer segment, service recoveries, product decisions, and respondents notified.
Choose no more than a few owned actions. A long list of observations without owners will not improve the next customer experience.
Document what the team will not infer from the data. NPS does not reveal the entire market, prove causation, or replace usage and retention analysis. Its value comes from a consistent signal, detailed comments, and a disciplined response loop.
Before the next survey, verify that previous respondents received promised follow-up and that questions still match the product journey.
Keep an owner for the full program, not only survey delivery. Collection, analysis, service recovery, product decisions, and customer communication must remain one operating loop.